The Entryway: Q1 2025 Market Update & Outlook
Year-end Review:
In 2024, the U.S. stock market and economy faced an intricate and somewhat volatile environment as the country wrestled with persisting inflationary pressures, fluctuating interest rates, shifting growth expectations and a contentious election cycle. Despite the noise and shifting landscapes, companies continued to find ways to innovate, hire and reinvest in their businesses. Ultimately these dynamics lead to a resilient U.S. economy and a strong consumer. These factors contributed to another phenomenal year for most risk assets, with the S&P 500 up over 20% on the year. In fact, this was the first time since 1998 that the S&P 500 had back-to-back years of over 20% returns. To put that in perspective, in 1998 Bill Clinton was president, Google was founded and Mark McGwire hit his 70th home run – so it’s been a while!
While the performance of the U.S. stock market broadened some, there continues to be a significant divergence between the average stock within the S&P 500 vs. mega-cap technology stocks (specifically companies surrounding artificial intelligence). For instance, the S&P 500 was up 24.5% on the year while the average stock in the S&P 500, as measured by the S&P 500 equal-weighted index, was up 12% in 2024. Said differently, there are a select few, albeit dynamic, companies that are driving U.S. markets higher. We believe most investors know this but discount the magnitude of the variance between “market returns” and individual company performance.
According to Howard Silverblatt, Senior Index Analyst at S&P Dow Jones Indices, Nvidia’s 171% return in 2024 contributed more than 22% to the S&P 500’s overall return. Apple, Amazon and Meta (Facebook) accounted for 7.4%, 5.9% and 5.5% of the index’s full-year return, respectively. In other words, four companies within the S&P 500 accounted for over 40% of the entire index’s total return in 2024! While we celebrate the dynamic year of 2024 with our clients, this market concentration is something we continue to monitor and plan around.
At the end of 2024, here is where the major public market indices stood and their last three years’ performance:
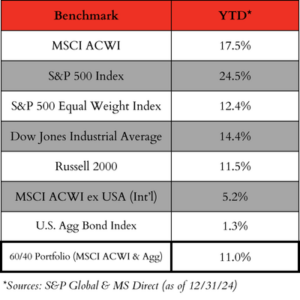
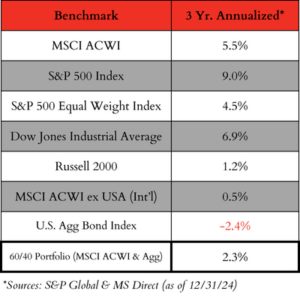
While our clients enjoyed another successful year, it is important for us to remember that asset prices don’t go straight up, as evidenced by the three-year annualized performance numbers, which include 2022 – an objectively terrible year for all asset classes. To that end, we continue to be more cautious within our overall asset allocations, stock exposure (i.e. owning these great technology companies but being more balanced than the index), and cash and equivalents exposure. We believe this is the most prudent approach for our clients as our priority is to protect the hard-earned wealth they have accumulated over the years and diversify their dollars between more high-quality assets than just a select few companies concentrated at the top of the S&P 500.
At the end of 2024, the top 10 companies in the S&P 500 represented about 39% of the entire market cap of the S&P 500. This is the highest concentration of market capitalization within the S&P 500 on record and makes the overall market more susceptible to outsized moves (up and down). In addition, a high concentration at the top heavily influences index valuations.
At the time of this writing, the S&P 500 was trading at about 21.5 times forward earnings or about 25% more expensive than its 30-year average. While higher than average price-to-earnings ratios do not necessarily correlate to one-year returns, the overall elevated valuations are something we are continuing to monitor as they greatly inform expectations for subsequent 10-year returns. In short, the higher the price-to-earnings ratio goes, the lower the future expected return over the subsequent 10-year period.
While a “reversion to the mean” may happen immediately in 2025, it may not. We do not have a crystal ball, and no one else does either! However, statistics and history tell us that the highest probability of success for investors is to have a plan and stay invested. In addition, while markets are at all-time highs and valuations are high, this “bull market” is still historically small in both length of time and overall returns. In fact, the average length of a bull market (i.e. when stock prices have gone up 20% or more from the previous low) is about six years with a total return during that period of about 180%. To date, we’re about two and a half years into the bull market and have returned about 65%.
While we were thrilled to see asset prices rise again in 2024 for our clients, we continue to critically analyze the concentration risk in the stock market, elevated current valuations and how the current interest rate policy of the Fed, the economy at large and the implementation of the incoming administration’s policies may impact companies and their earnings.
Market Outlook:
While there continue to be some indicators like consumer debt delinquencies ticking up and the average personal savings rate trending lower than its historical average, the underlying consumer within the United States remains very solid. The U.S. labor market ended 2024 on a strong note with the unemployment rate ticking down to 4.1% and the prime age workforce (ages 25-54) also increasing. The employment rate, especially within this cohort, is extremely important. As the famous Ray Dalio once said, “One person’s spending is another person’s income.” In other words, the overall Gross Domestic Product (GDP) in the United States is about 70% consumer spending, so the U.S. needs people to work, earn a good living and spend. While the unemployment rate has edged up to 4.1% from a low of 3.4% set in April 2023, it has now remained at or below 4% for three years – the longest such stretch since the late 1960s.
In addition, there are other supplementary indicators that evidence a stable consumer on firmer footing than previous cycles. The current household debt service ratio stands at about 11% (i.e. debt payments as a percent of disposable income), which is about 30% lower than its peak in late 2007. As we have mentioned in the past, most households smartly took advantage of previous interest rates to lock in low fixed rates. Currently, about 90% of U.S. household debt is fixed vs. floating rate debt, and most of the debt is at historically low interest rates. Lastly, consumers and savers are still taking advantage of the higher cash interest rates this cycle – for example, most high-yield savings are still 4% or more. These are additional dollars to spend.
In addition to the consumer, businesses are continuing to ramp up re-investments within their companies as evidenced by the material AI capital spend, which positively contributes to current and future GDP growth. For instance, through Q3 2024, companies deployed over $170 billion in AI capital expenditures, a 56% year-over-year increase from 2023. While it is debatable how much of a return on investment all these dollars may receive, there is no denying the amount of momentum, productivity potential, and current and new businesses riding the AI wave at the moment.
Inflation, interest rates, government policies and more will always influence individual and company behaviors, and there will undoubtedly be winners and losers throughout the years. However, the answer will only be obvious in hindsight. As stewards of your hard-earned wealth, we believe it is critical to block out the noise and anxiety constantly thrown at us each day and try the best we can to focus on the things we can truly control.
Thank you
In closing, we want to thank you for your trust, and we are grateful for the opportunity to serve you and your families.