The Entryway: Q3 2026 Market Update & Outlook
Market Snapshot:
If the second quarter was about dynamic earnings growth outweighing a wall of worry, the third quarter was about inflation, the Fed, interest rates, and the bond market. On the surface, the equity markets made things look calm with major indices reaching all-time highs during the quarter. However, underneath, it was anything but quiet with interest rates breaking out to levels we haven’t seen since 2007, the Federal Reserve raising rates for the first time in three years, and the conflict with Iran flaring up again, pushing oil back above $100 a barrel – reigniting inflation worries.
At the end of the third quarter, here is where the major U.S. stock and bond indices stood:
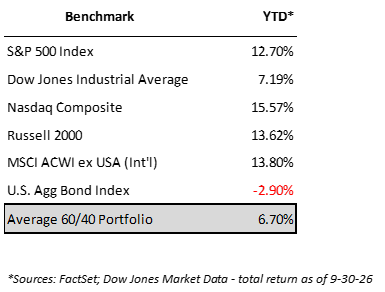
During the third quarter markets rotated vs. retreat. The calm headline numbers hide a meaningful reshuffling of leadership within the market. The AI and semiconductor trade that carried the first half of the year somewhat cooled off, while energy led all sectors (+17.2%) as oil climbed, with technology (+7.2%) and health care (+6.5%) also positively contributing to returns. On the negative side, the sectors most sensitive to interest rates struggled as yields rose. Utilities fell ~12.4%, real estate stocks fell ~5.6%, and industrials gave back ~9.7% during the quarter. This combination of sector rotation and interest rate pressure caused underperformance in several major indices including the Dow Jones Industrial Average (down ~2.5% in the quarter) & Russell 2000 (down ~7% in the quarter). The DOW was weighed down by rate-sensitive value sectors and industrials while the Russell 2000 declined as smaller companies faced intense borrowing cost pressures from higher interest rates.
While many companies, countries, and parts of the economy are benefitting in this environment, markets continue to be dominated by the “AI trade”. As we’ve mentioned in the past, the “AI trade” is more than just the model companies (Anthropic, OpenAI, xAI, Gemini, etc.) and really is an “AI ecosystem” consisting of:
- Energy – power generation, grid & electrical equipment, fuel, materials, etc.
- Chips and Compute – GPUs / TPUs / CPUs, memory, design, manufacturing, etc.
- Cloud Infrastructure – data centers, networking, servers, platform optimization, etc.
- AI Models – large language models (open + closed models)
- Applications – coding, agents, industry tools, agentic ecosystems, etc.
On the one hand, the market is indeed broadening within sector performance (industrials, energy, healthcare, financials), market cap (small caps continue to do well), and internationally (main international indexes have materially outperformed the S&P 500 index since January 2025). On the other hand, one could argue that all the momentum and market performance is still based around one theme – the AI build-out / ecosystem.
The bottom line is in order for the economy, companies, and the market to continue to do well there needs to be a return on these investment dollars and those earnings need to be sustainable and continue to grow. So far, companies have been able to capture higher revenues, expand their margins, and earn more money.
Earnings. As mentioned, the single most important reason stocks have held up in the face of all the uncertainties this year is profits. In fact, taking into account Q3 earnings estimates, the S&P 500 profits are growing at roughly 4x their 25-year term average:
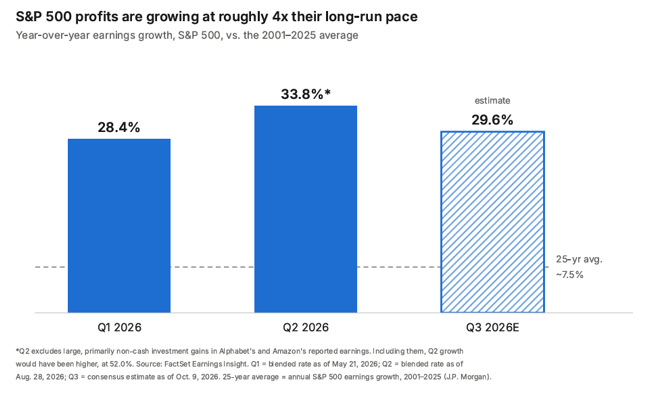
This dynamic earnings growth has not only allowed companies to continue to fund their AI build-out (although only partially now), increase share buybacks and be acquisitive (buying companies or talent), but it has actually made the market cheaper. The S&P 500 now trades at roughly 19x forward earnings, down from ~20.5x when we wrote to you in July, and roughly 10% above its 30-year average of ~17.2x. In other words, prices have followed higher profits rather than running ahead of them. While these earnings are impressive, the size and scale of this AI buildout is unprecedented with companies across the AI ecosystem spending and borrowing unprecedented amounts of money to compete for market share / dominance. No greater example of this “arms race” is within the cloud infrastructure companies (aka the “hyperscalers”).
Hyperscalers – the AI buildout. The five largest hyperscalers (Alphabet, Amazon, Meta, Microsoft, and Oracle) are expected to invest roughly $800 billion in 2026, nearly double last year, with consensus calling for more than $1 trillion in 2027. The size of these numbers are almost impossible to comprehend and are now beginning to exceed most, if not all, the historical “mega projects” our country and the world have ever seen.
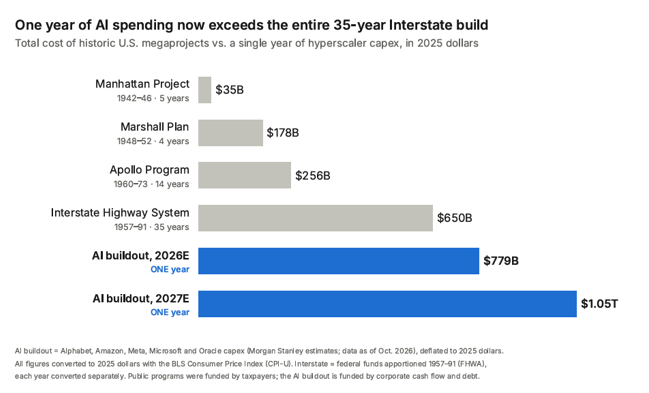
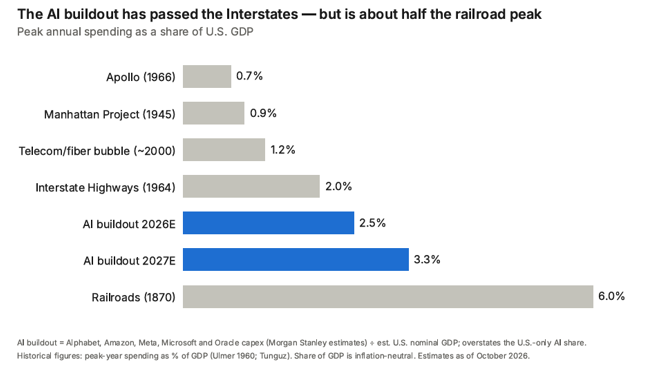
While Amazon, Alphabet, Microsoft, Meta, and Oracle are some of the most successful and profitable businesses in human history (over the trailing twelve months these companies have collectively generated about ~$1.85 trillion in revenue and ~$600 billion in net income!), they cannot even keep up with the spending requirements. This was a recent major change this quarter as the AI buildout is now being paid for with more and more debt (i.e., bonds) and off-balance-sheet commitments rather than purely from operating cash flows. In addition, the AI buildout is getting closer to representing a higher percentage of annual spending as a share of U.S. GDP.
The Bond Market and the Fed: Rates Reset Higher
In our opinion, the bond market was the real story of the third quarter. The 10-year Treasury yield, which ended June near 4.46%, crossed the closely watched 5% threshold in mid-September and finished the quarter at 5.29%, its highest level since 2007. The 30-year closed at 5.64% and the 2-year at 4.88%. Because bond prices fall when yields rise, the Bloomberg U.S. Aggregate Bond Index lost 3.5% in the quarter and is now down 2.9% for the year. For households, the move shows up most directly in borrowing costs, with 30-year mortgage rates back around 7%.
Three forces drove the move:
- Policy. The Fed turned from cutting to hiking (more below).
- Uncertainty. With the paths of inflation and deficits harder to forecast, investors are demanding extra compensation for lending to the government for longer periods.
- Supply. The Treasury continues to finance large deficits, which means they have to issue more and more debt / bonds. In addition, there is now more competition as the AI giants are now borrowing heavily.
The Fed’s first hike in three years. In September, the Federal Reserve raised its benchmark rate by a quarter point to a range of 3.75%–4.00%, the first increase since 2023 and the first real test for new Chair Kevin Warsh. The vote was unanimous, and Chair Warsh was direct: inflation has run too high for too long, and the committee intends to restore price stability. He framed the move as easing off the accelerator rather than slamming on the brakes. The Fed’s updated projections call for headline PCE inflation of 3.7% by year-end, easing to 2.3% sometime in 2027. This is a remarkable reversal considering coming into 2026, markets were pricing in two rate cuts this year. Today the question is how many hikes remain. Expectations have been whipsawing: odds of another hike at the October 28th meeting fell from roughly 70% to about 18% after a weak September jobs report (more on that below). Our view is that the Fed will remain data-dependent and reluctant to tighten aggressively into a softening labor market, but the days of assuming the next move is down are over, at least for now.
Our take on bonds: the pain is also the opportunity. No one enjoys watching bond prices fall. But the yield you start with has historically been the single best predictor of what a high-quality bond portfolio will earn over the following five years. The Aggregate Bond Index now yields roughly 5.56%, which is among the highest levels in nearly two decades, and that income provides a meaningful cushion against further rate increases that simply didn’t exist over the last 15+ years.
We continue to favor high-quality, short-term bonds, which capture much of the available yield with less sensitivity to further rate moves, and municipal bonds where tax brackets make them compelling. Credit spreads continue to remain near historically tight levels, so we see little reward for reaching into lower-quality credit right now. Lastly, the rise in interest rates has been good for Money Market Funds as those reserves continue to earn a meaningful yield (~3.70% – 3.85%).
Macro Update: Iran, Inflation, Jobs & the Consumer
Iran and energy. In our last letter, we wrote that we were cautiously optimistic the worst of the Iran conflict was behind us. The third quarter reminded us why we said cautiously. After the June ceasefire framework pulled oil back toward pre-war levels, tensions flared again late in the summer. Oil climbed above $107 a barrel in mid-September before settling near $90 at quarter-end, U.S. diesel prices hit a record, and gasoline is again well above $4 a gallon in much of the country. We aren’t going to predict how this ends. What we can say is that the U.S. economy is far better equipped to absorb an oil shock than it was in the 1970s: we are now the world’s largest crude oil producer, and we use far less oil to produce each dollar of economic output than we did fifty years ago.
Inflation is an energy problem, for now. Headline consumer prices rose 3.4% over the past year through August, down from a 4.2% peak in May. But strip out food and energy and core inflation is running at just 2.4%. Energy prices alone are up about 16% year over year, with gasoline up about 27%. In other words, today’s inflation is concentrated where you’d expect during an oil shock. The Fed’s worry, and the reason it hiked even as core inflation cooled, is that consumers start expecting higher prices. Household expectations for inflation over the next year rose to 4.6% in September, and keeping those expectations from becoming entrenched is one of the central lesson of the 1970s.
The labor market is cooling in earnest. The September jobs report was a genuine disappointment. Employers added just 29,000 jobs against expectations of roughly 90,000, prior months were revised lower, and the unemployment rate edged up to 4.2% from 4.1%. Over the past 12 months, the economy has added only about 41,000 jobs per month. Wage growth slowed to 3.0% year over year, which means that for the typical worker, paychecks are no longer keeping pace with 3.4% inflation. To keep this in perspective, a 4.2% unemployment rate remains well below the ~6% fifty-year average and in general people are not being let go. So, while the labor market is still healthy, it is starting to show some signs of fragility.
The consumer: still spending, but running on fumes in the middle. On the surface, the consumer looks fine. Personal spending rose 0.9% in August, its fastest monthly pace in over a year. Underneath, the math is less comforting: personal income grew just 0.2%, and households covered the gap by dipping into savings, pushing the saving rate to its lowest level in nearly four years. Confidence has followed: the Conference Board’s consumer confidence index fell to 81.9 in September, its weakest reading since 2014, and the University of Michigan’s sentiment index sits at 48.1 versus a long-term average of 77.2.
The “K-shaped economy” we’ve written about for years is now showing up plainly in company results. Value-driven or premium restaurant chains like Texas Roadhouse (+6.2%) and Chili’s (+5.1%) are growing comparable sales, while middle-market names like Papa John’s (-8.3%) and Wingstop (-7.5%) are losing ground. At Dave & Buster’s, food and beverage sales rose while entertainment revenue fell nearly 9%: customers are still showing up but eating instead of playing. The most telling signal may be buy now, pay later (BNPL) financing, which has moved beyond sneakers and electronics into rent, electricity, and utility bills. When a household splits its electric bill into four payments, it isn’t managing a purchase; it’s managing a shortfall.
The reason the overall numbers still look healthy is that the top 20% of earners account for roughly half of all consumer spending, and those households are cushioned by higher home and stock values. A K-shaped economy can keep growing while half its consumers retrench, but it becomes more fragile if the labor market cracks.
One contrarian note worth keeping in mind: gloomy consumers and poor stock returns don’t always go hand in hand. Historically, the S&P 500 has gained an average of roughly 24% in the 12 months following troughs in consumer sentiment, versus about 5% following sentiment peaks. That isn’t a timing signal, and no one knows whether September marks the bottom. But it is a useful reminder that markets are a forward-looking machine while headlines look back.
Corporate spending remains the counterweight. Even as households tighten up, businesses are investing aggressively, led by the AI buildout. Real GDP grew at a 2.2% annualized pace in the second quarter, with consumer spending and business investment doing the heavy lifting. As long as corporate profits keep growing at their current pace, companies have the means to keep hiring and investing, which is the bridge the economy needs while energy prices work through the system.
The Road Ahead: Midterms and a Crowded Calendar
The fourth quarter brings a busy calendar: third-quarter earnings season is underway, the Fed meets again on October 28th, voters head to the polls on November 3rd, and Congress faces a December 11th government funding deadline. Any of these, along with developments in Iran, could stir up volatility, and we wouldn’t be surprised by a bumpier ride into November and through the remainder of the year.
Elections always bring heightened emotions. But history is remarkably consistent on one point: the S&P 500 has been higher 12 months after every midterm election since 1950, regardless of which party prevailed. The stretch from the fourth quarter of a midterm year through the second quarter of the following year has historically been the strongest period of the four-year presidential cycle. That said, seasonality is a tendency, not a law. The fourth quarter of 2018, also a midterm year, brought a nearly 20% decline in the S&P 500 before stocks recovered to new highs in 2019.
Putting it all together, we remain cautiously optimistic, with the emphasis on cautiously. Earnings growth is exceptional and broadening, the economy is resilient, and the calendar is historically favorable. On the other side of the ledger, valuations leave little room for disappointment, concentration remains near historic extremes, the labor market is softening, and a 5% Treasury yield gives investors a real alternative to stocks. We believe this is a market that rewards discipline over bold bets: stay invested, rebalance toward your targets, own the income that higher yields now provide, and diversify rather than concentrate. We would strongly caution against making portfolio decisions based on anticipated election outcomes.
Thank You!
In closing, we are grateful for the opportunity to serve you and your families, and we never take your trust for granted. We work incredibly hard to attract and retain people who bring an entrepreneurial spirit, a relentless drive, and a servant’s heart to their work, because our people and our culture are the foundation of everything we do for you.
We love our team and we are excited to introduce to the Red Door Family, our newest strategic advisory team member, Henry Wood: